Oselote
The Silver Trust ETF (NYSEARCA:SLV) is a simple and convenient way for investors to gain exposure to the silver market without the need to purchase and store physical silver. The correlation between an SLV and spot silver (XAGUSD:CUR) is generally very strong. Spot silver is the current market price at which silver is being bought and sold for immediate delivery. However, SLV is designed to track the spot price of silver as closely as possible, and the value of the ETF is based on the value of the underlying physical silver that it holds.
The spot silver has developed a strong bottom at a long-term support level of $17.60 and is now moving higher. Due to the high inflation, rising interest rates, high debt, and a slowing U.S. economy, the silver market is projected to gain strength and remain strong in 2023. On the other hand, the gold-silver ratio peaked in 2020 and is now declining with a bearish technical formation. The decline in the gold-silver ratio has increased the likelihood of a significant silver rally in the coming years. The initial resistance in the spot silver market is $35, with a long-term objective of $50. Nonetheless, the development of the cup and handle on the yearly chart implies that a breakout above $50 could result in a powerful millennium rally in the silver market. The price structure of the silver market is extremely bullish on all respective long-term charts, with $19-$20 serving as a strong buying opportunity for long-term investors.
Silver During Economic Slowdown
The investment demand for physical silver is significantly higher in 2022, and spreads are way larger. The sizable spread on the physical market sets the tone for investors and further boosts silver demand in the global market. As discussed in a previous article, the Consumer Price Index (CPI) has increased by 7.1% over the past 12 months, resulting in a significant rise in inflation. As a result, the Federal Reserve was prompted to raise interest rates above 4% in order to slow inflation. The higher inflation has increased the likelihood of a recession. The likelihood of a recession in 2023 influences investor demand for precious metals, which has a positive effect on silver prices.
Increasing debts, inflation, and interest rates have a negative effect on the U.S. economy. On the other hand, based on the fundamental and technical analysis presented in the previous article, the US dollar index has already achieved its primary objective and is retracing to much lower levels. The decline in the U.S. dollar index will result in increased silver demand. Despite the Federal Reserve’s efforts to raise interest rates, I believe inflation will remain elevated in 2023 due to a number of factors, including higher retail sales, the likelihood of a decline in building permits, a significantly lower unemployment rate, and energy shortage.
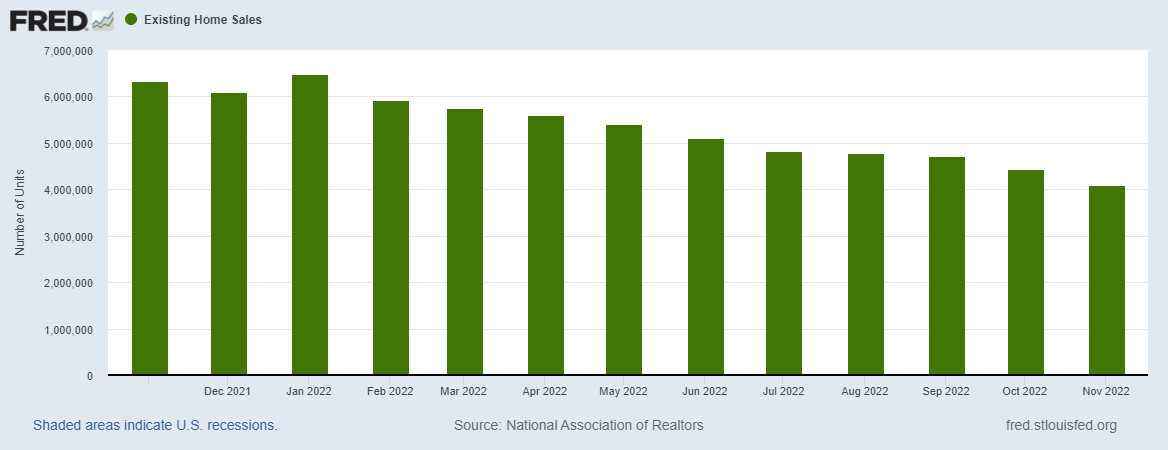
As shown in the chart below, existing home sales have declined for ten consecutive months and currently stand at 4.09 million in November 2022, a 37% decline from the peak in January 2022. However, monthly mortgage rates are increasing. The rising mortgage rates discourage new buyers. Home sales are expected to decline further, while mortgage rates will continue the upward trend due to the economic slowdown in 2023.
Gold-Silver Ratio – An Indicator To Buy Silver
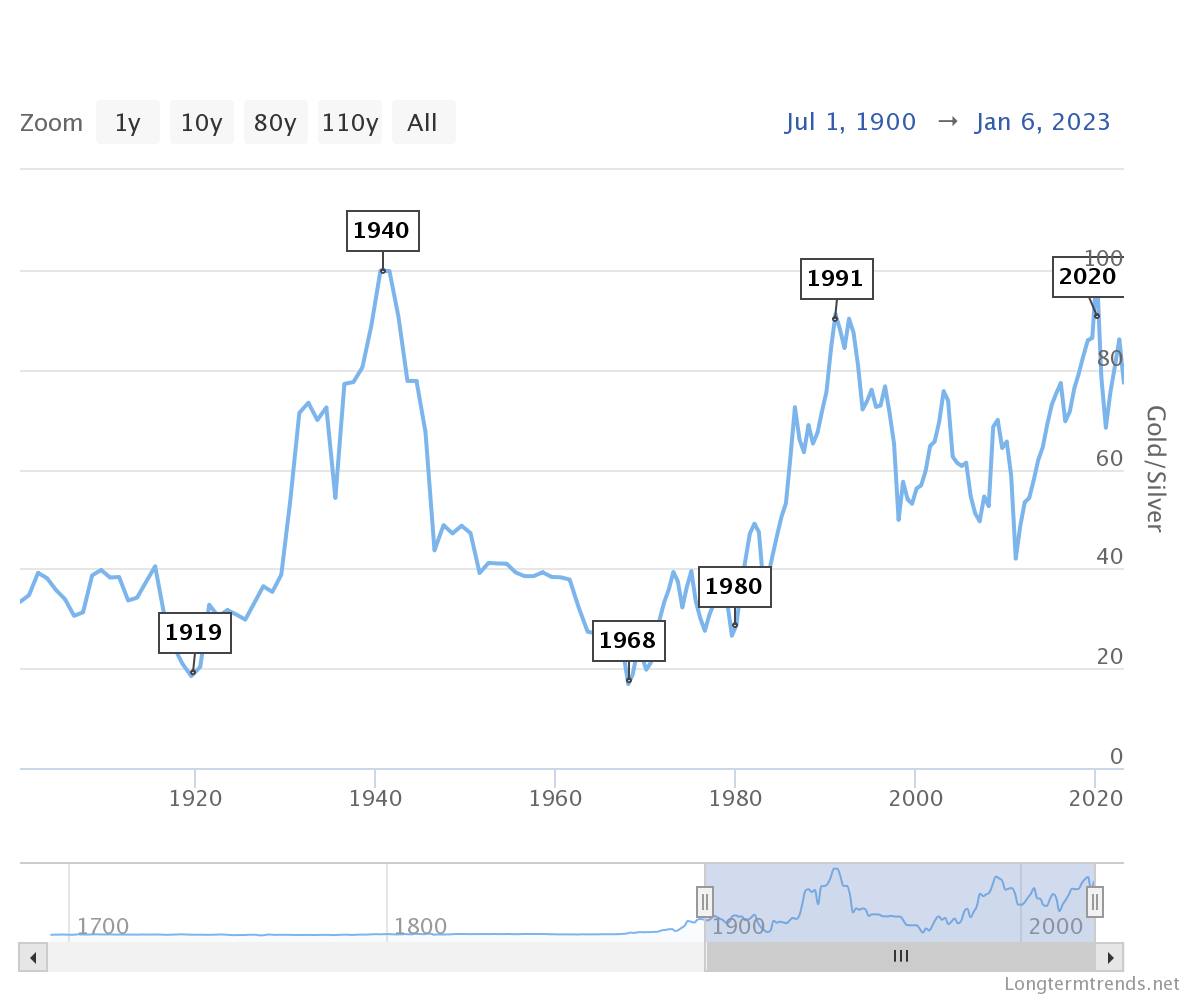
The financial instruments have relationships based on the market’s fundamental development. Nevertheless, the correlation can also be observed on the technical charts of the instrument. The gold-silver ratio is highly correlated with the silver market to gauge the next momentum in the gold and silver prices. When the gold-silver ratio falls it indicates higher silver prices. The chart below depicts the gold-silver ratio over the past 122 years. It is observed that silver prices show a slightly negative correlation to the gold-silver ratio. When the gold-silver ratio bottomed in 1980, spot silver prices marked a peak at $50. The gold-silver ratio continues to rise after 1980 until it peaks in 1991 when silver bottoms. During the gold-silver decline from 1991 to 2011, spot silver prices rose sharply to $50.
gold-silver ratio (Longtermtrends)
Currently, the gold-silver ratio peaked in 2020 and falling sharply lower which indicates that silver prices will go much higher. The price structure in the gold-silver ratio is bearish as per the spike of 2020. Based on recent developments in the gold-silver ratio, it appears that the silver market is about to make its next significant move higher.
Technical Parameters For Silver Market
Historical Analysis
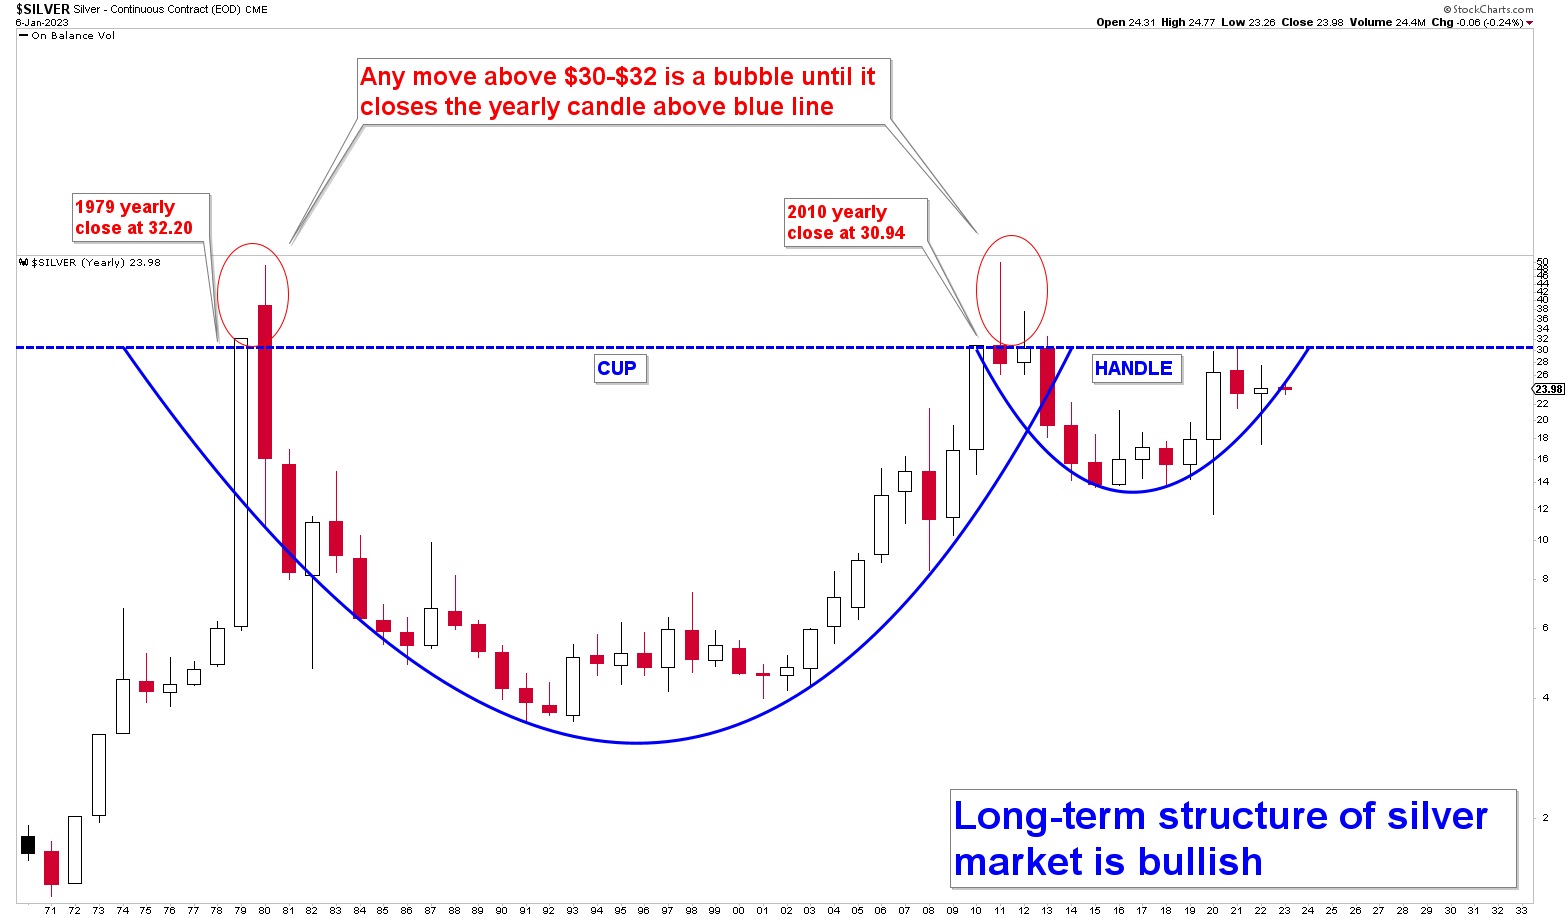
The chart below depicts the long-term structure of the silver market. The formation of the cup and handle can be observed from the chart, whereby there has been no yearly close above $32.20 in the past 42 years in the spot silver market. The yearly close for 1979 was $32.20, while 1980 peaked at approximately $50 before reversing course and closing below the blue line. A similar price action was observed in 2010, whereby the yearly candle for 2010 closed at $30.94 followed by a spike in 2011. The 2011 yearly candle produced a spike before reversing course and closing below the blue line. This phenomenon indicates the significance of the silver price at levels $30-$32. The price attempted to reach $30 levels again in 2020 and 2021, but encountered formidable resistance and retreated lower. However, the pullback in 2021 and 2022 was merely a pullback due to the strong historical resistance at the $30 level and produced a strong bullish price action as indicated by the bullish wick on the 2022 yearly candle. Therefore, it suggests that 2023 will be bullish and that prices have the potential to rise. The scenario is elaborated on in the next section.
Silver Yearly Chart (StockCharts)
Present Situation of Silver
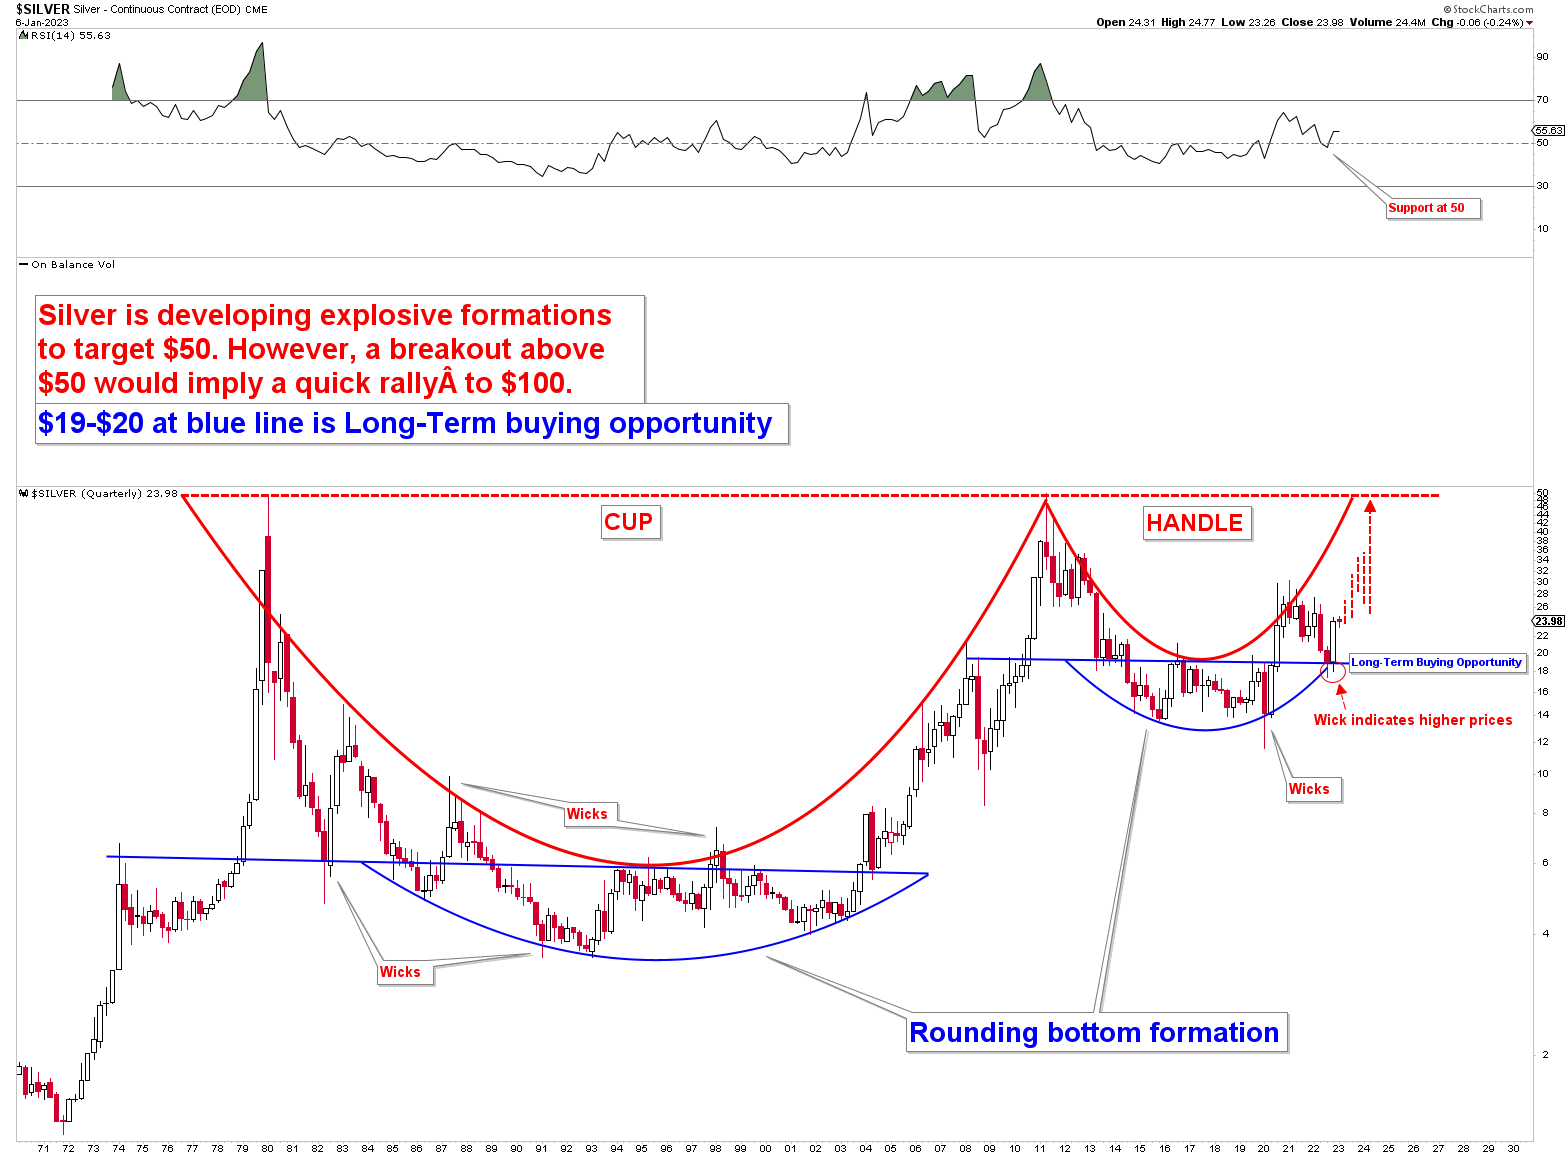
The formation of the cup and handle can further be explored by looking into the silver quarterly chart. The similarity of patterns during the rounding bottom formations of the cup and handle can be observed in the blue rounding bottoms. Since silver is a highly volatile instrument, therefore, when any candle produces a wick, the price reverses the direction. The most recent wick is observed near the blue line between $19 and $20, indicating that the price has the potential to go much higher. Long-term investors aiming for at least $50 in 2023 and 2024 should consider this level a powerful buying opportunity.
Silver Quarterly Chart (StockCharts)
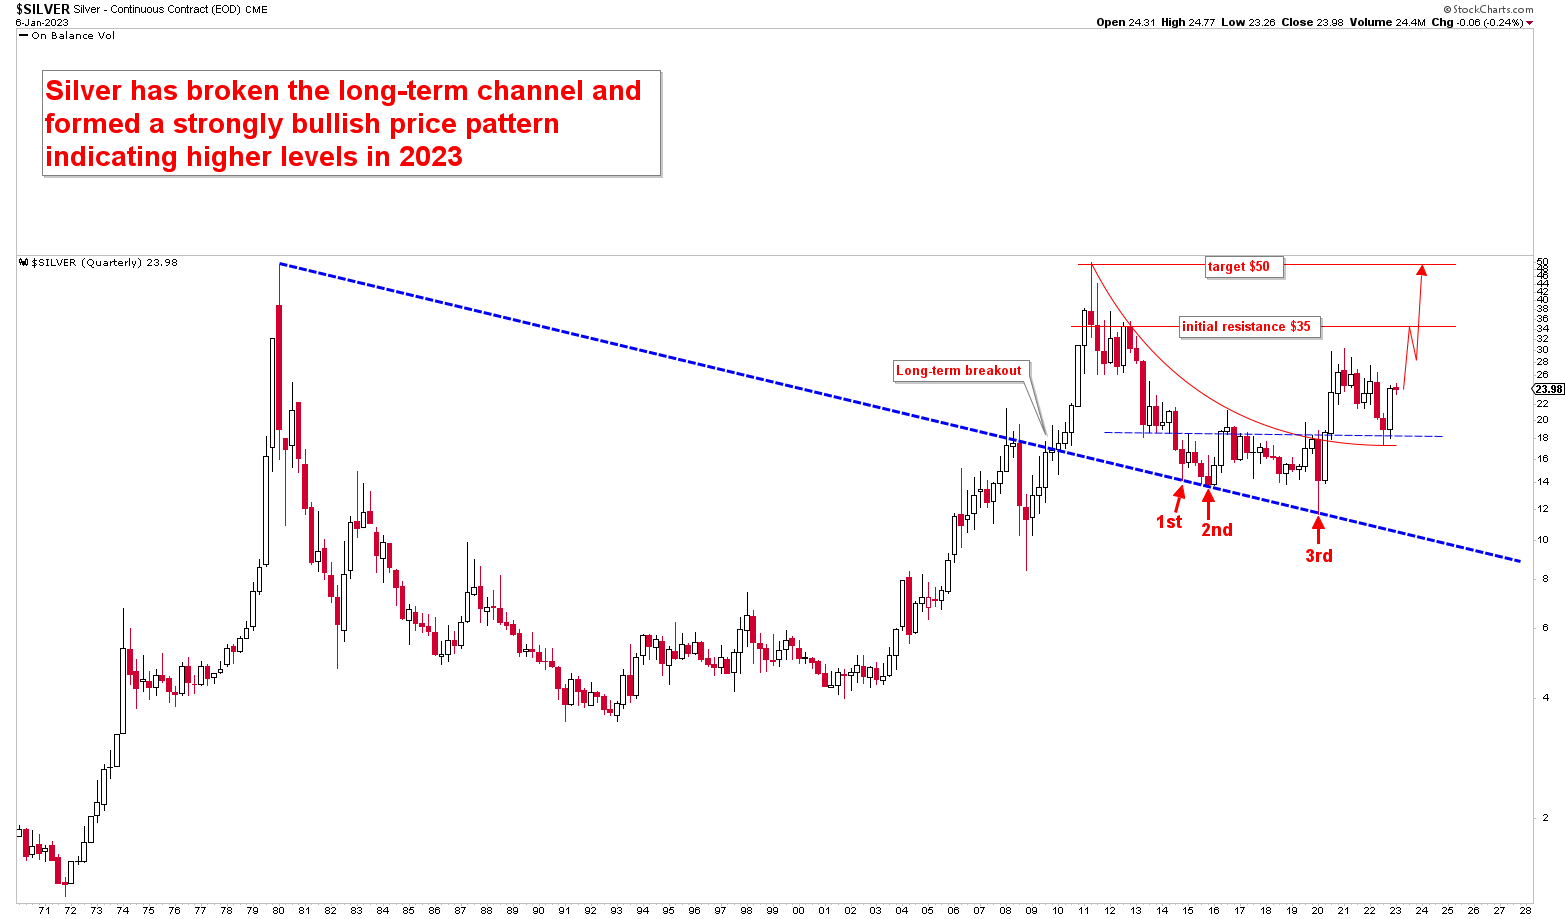
The present situation in the silver market can also be studied by looking at the silver quarterly chart below. The chart below depicts the long-term trend line that was broken in 2010, followed by a swift rebound to $50. Normally silver and gold markets rally after the 3rd or 5th touch of the breakout. The 3rd touch of the breakout line was a sharp rally and induced an advance to $30. However, the 5th touch produced a strong rally and it looks like the price can break to higher levels with the potential to break $50. Based on the 5th touch, the dashed line between $19 and $20 is regarded as a long-term buying level. This recent rally is likely to take silver to $35 as initial resistance and then to $50 as the actual target. The bullish price action can also be observed using the bullish price action on the daily silver chart, whereby the price has broken the neckline of the inverted head and shoulders and is on the way to hitting the target of $27-$30 dollars.
Silver Quarterly Chart (StockCharts)
Market Risks
Investing in silver carries a greater risk than investing in other asset classes due to the higher tax rate on silver’s capital gains. Another factor to include is the real bond yields which have already seen a peak. However, there is still a risk of a deflationary credit crunch as in the case of 2020 which produces a spike in real yields. The spike in real yield normally produces pressure on silver prices.
As the price action has developed strong bullish formations for a move higher, silver now carries the least risk in terms of overall gains. Price appears to have the lowest probability of falling below $16 levels. On the other hand, real bond yields have already reached the peak, and the economic crisis resulting from Covid-19 and the Russia-Ukraine conflict has had a positive effect on the silver market. Therefore, investing in the silver market has the least risk in 2023.
The Bottom Line
Based on the preceding fundamental and technical analysis, silver has the potential to be one of the safest and most lucrative investments in 2023. The economic slowdown and potential for a recession will increase silver demand. The gold-silver ratio has peaked, indicating that more silver should be retained in the portfolio. On the yearly and quarterly charts, the formation of a cup and handle with a rounding bottom suggests that the silver market will likely benefit from fundamental developments. The long-term pivot for spot silver is $17.60, and there has been no breakout from this pivot; instead, the price has broken higher. Currently, there is a strong buying opportunity for spot silver at the $19-$20 level, targeting $35-$50. Investors can gain exposure to the silver market through SLV without holding physical silver, as holding SLV incurs lower fees and expenses than holding physical silver, making it the cost-effective option.