GBP/USD – Prices, Charts, and Analysis
- US ISM data suggest the US economy is contracting.
- GBP/USD rallies but Sterling is not the driver of the move.
Recommended by Nick Cawley
Download our brand new Q1 GBP guide
Economic activity in the services sector contracted in December for the first time since May 2020, according to the Institute for Supply Management, suggesting that recessionary pressures are building in the US. The report, released last Friday, showed the headline figure fall to 49.6 from a prior 56.5, while business activity fell by 10 points to 54.7. The numbers suggest the US economy is heading for, or may even be in, a recession in the early part of 2023.
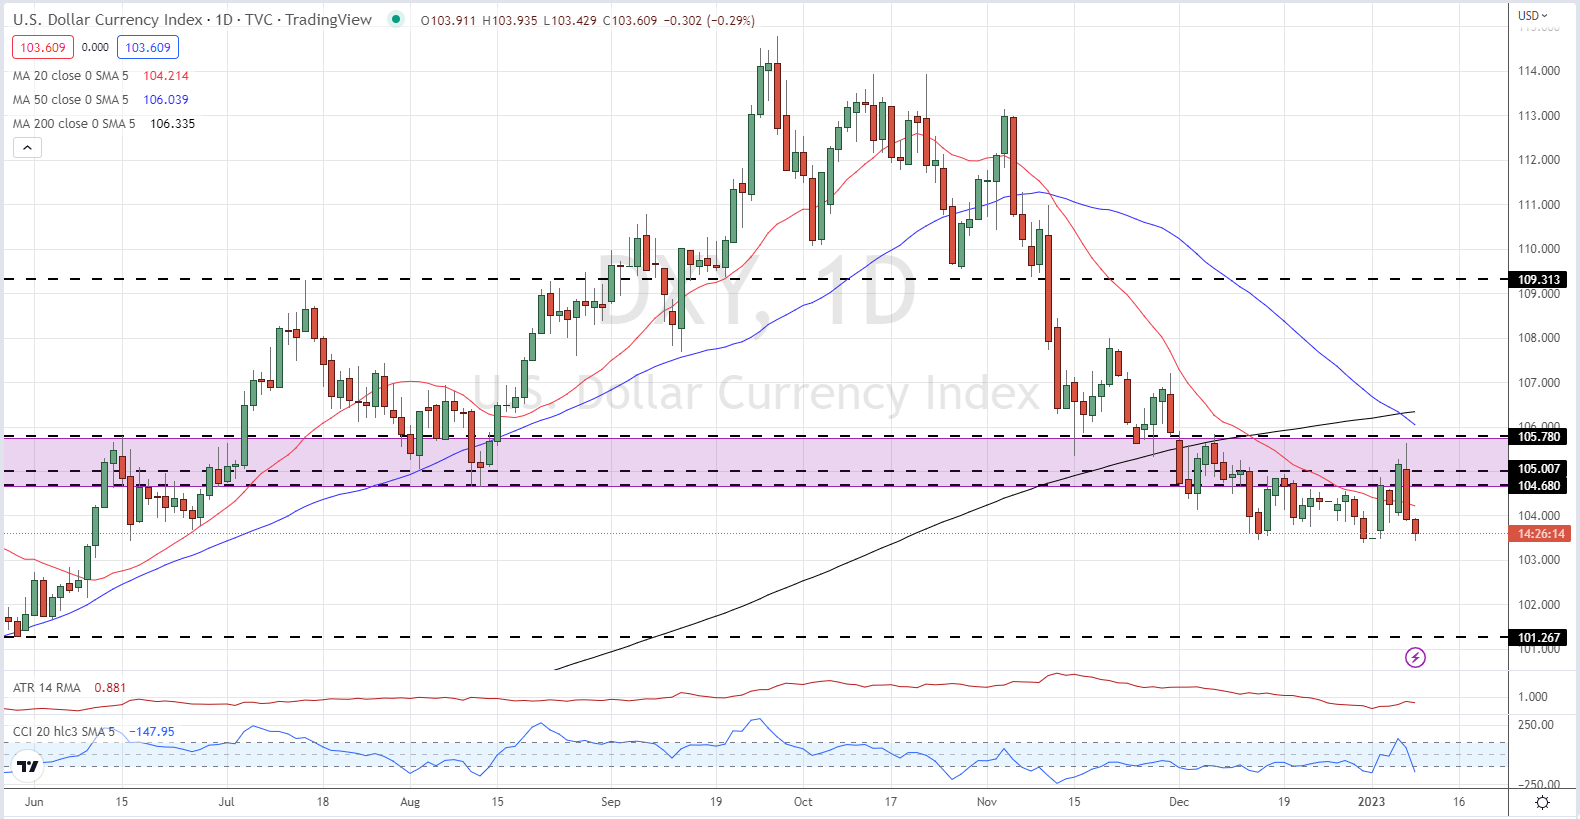
Friday’s weaker-than-expected ISM data, and lower average hourly wage growth seen in the latest US Jobs Report, hit the US dollar hard. The greenback just failed to make a fresh multi-month low but remains weak with little short-term support seen on the daily chart.
US Dollar Currency Index – January 9, 2023
For all central bank policy decision dates see the DailyFX Central Bank Calendar
Recommended by Nick Cawley
How to Trade GBP/USD
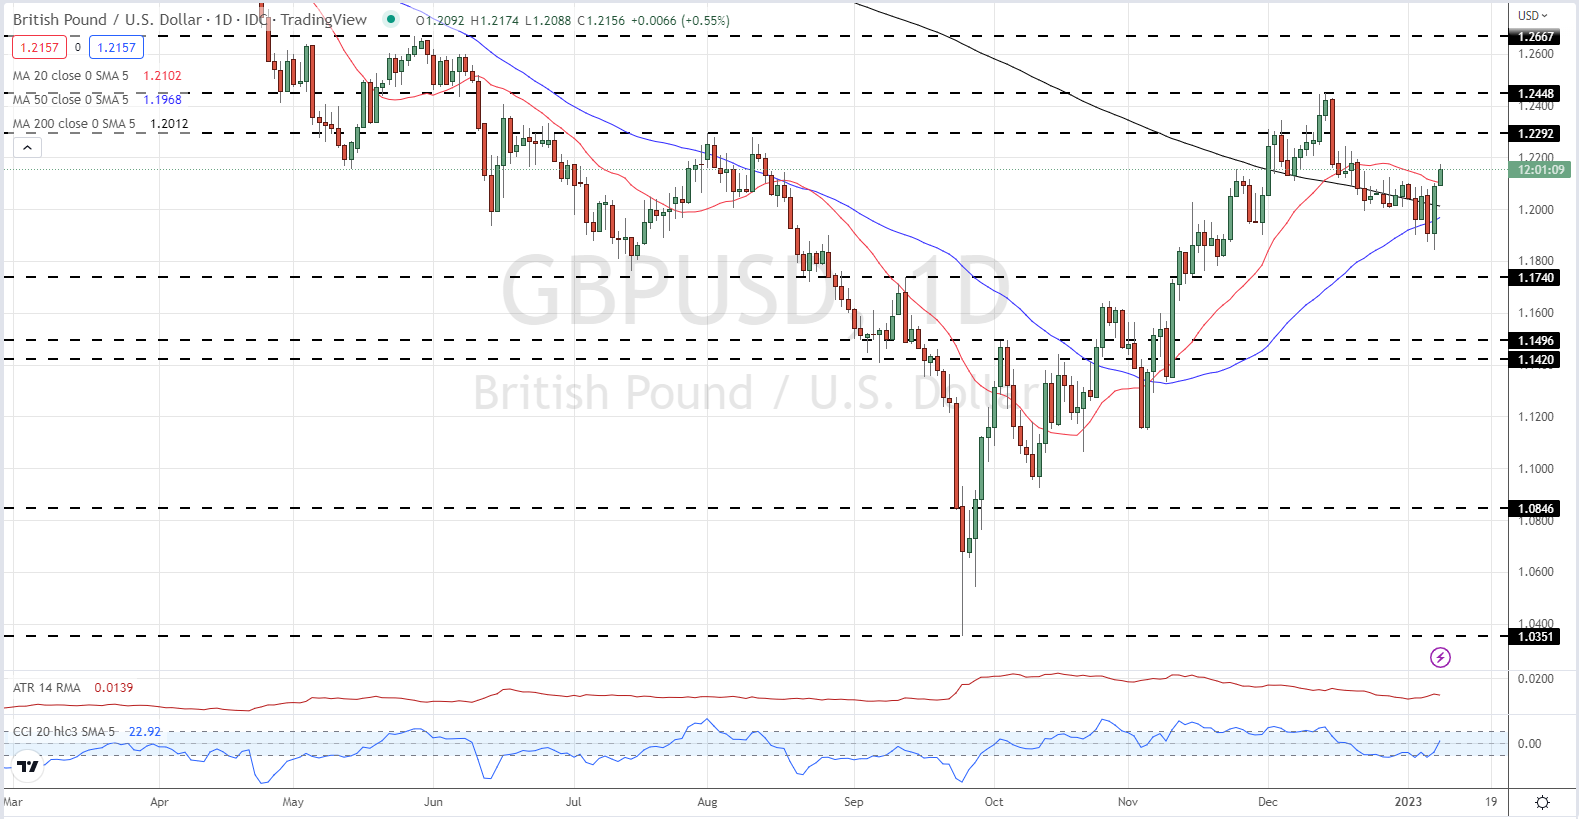
The US dollar sell-off is noticeable in a wide range of US pairs including cable (GBP/USD). The pair has rallied from a Friday low around 1.1850 to a current level of 1.2160 with Sterling in the passenger seat while the greenback drives the move. The British Pound is trying to move higher in itself today but the economic backdrop remains neutral to negative as the UK government struggles to control a raft of strikes currently hitting the country. The UK now needs to solve the current wave of industrial action otherwise the current small bid in Sterling will quickly evaporate.
After Friday’s US dollar sell-off, cable is now back above all three moving averages and a confirmation of this move in the next couple of days may well set the pair up for another leg higher. With little in the way of UK economic news until the end of the week, it looks likely that the US dollar will continue to be in charge of cable.
GBP/USD Daily Price Chart – January 9, 2023
Charts via TradingView
Retail Trader Bias Is Mixed
| Change in | Longs | Shorts | OI |
| Daily | 11% | 7% | 9% |
| Weekly | -6% | 20% | 7% |
Retail trader data show 45.45% of traders are net-long with the ratio of traders short to long at 1.20 to 1.The number of traders net-long is 6.28% higher than yesterday and 7.70% lower from last week, while the number of traders net-short is 0.65% lower than yesterday and 10.60% higher from last week.
We typically take a contrarian view to crowd sentiment, and the fact traders are net-short suggests GBP/USD prices may continue to rise. Positioning is less net-short than yesterday but more net-short from last week. The combination of current sentiment and recent changes gives us a further mixed GBP/USD trading bias.
What is your view on the British Pound – bullish or bearish?? You can let us know via the form at the end of this piece or you can contact the author via Twitter @nickcawley1.