ibreakstock/iStock via Getty Images
Investment Summary
Following a promising rally in October FY22′ we noticed that Inhibrx (NASDAQ:INBX) failed to break to new highs and were subsequently keen to analyse the price action further. Helping drive and sustain the rally in the first place was the company’s webcast on October 4 where it announced the regulatory pathway for its investigational INBRX-101 label, being examined in the treatment of alpha-1 antitrypsin deficiency (“AATD”). In a number of days, the stock bounced from $17 to $33 as investors learned INBX’s plans to potentially initiate registration for the compound in early FY23. The company has some additional data readouts to satisfy FDA’s requests, namely, “additional data on the correlation between functional AAT levels and the clinical benefit in AATD to further support serum AAT levels as a surrogate endpoint that is reasonably likely to predict clinical benefit, the prerequisite for accelerated approval.”
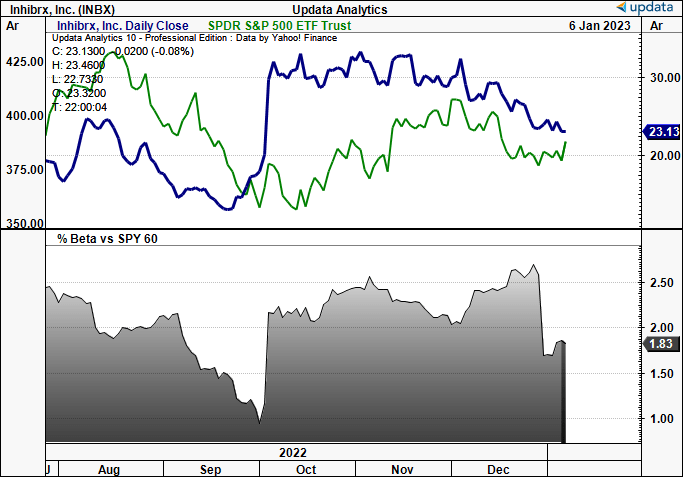
Following the announcement the upside was short-lived, and the stock has since consolidated in a lengthy sideways channel, converging towards the S&P 500’s range in the last 3 months of trade [Exhibit 1].
Exhibit 1. INBX converging to the S&P 500’s 3-month range, and to the downside
Here I’ll run through what market pundits are doing in INBX and illustrate why we don’t believe the stock will break out again anytime soon. Net-net, we rate INBX a hold, a suggested range of $18.75-$16.75.
Price action mute since rally
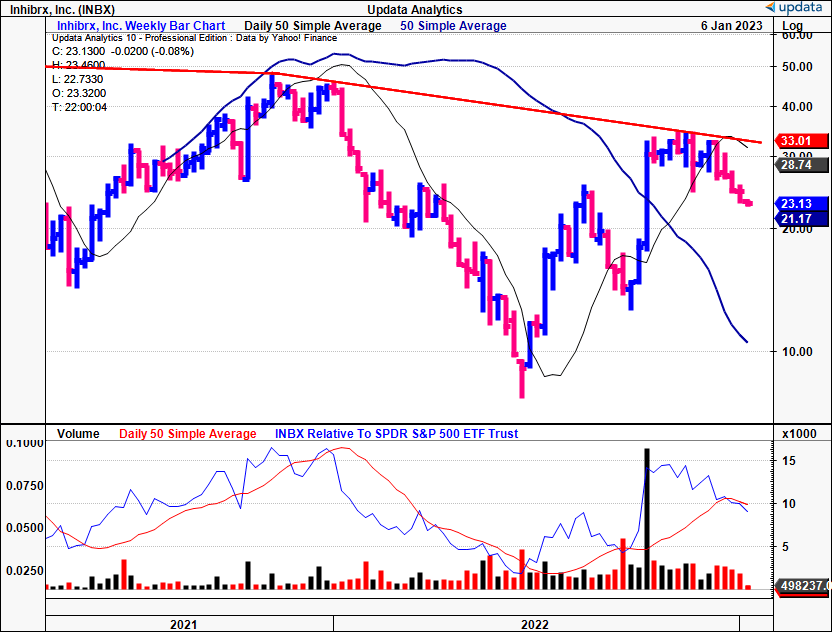
INBX caught a strong bid in October FY22 after first bouncing and recoiling from June-August, as seen below in Exhibit 2. After the second rally, shares broke to new highs and pushed to the long-term resistance level shown.
Added to that, the 50DMA and 250DMA crossed to the upside in late October, and the stock managed to hold this level for around 6 weeks. However, it couldn’t crack the resistance level shown, instead pushed sideways before buying support dried up.
Exhibit 2. INBX unable to break through upper trend line drawn, 50DMA and 250DMA divergence with 250DMA drifting lower.
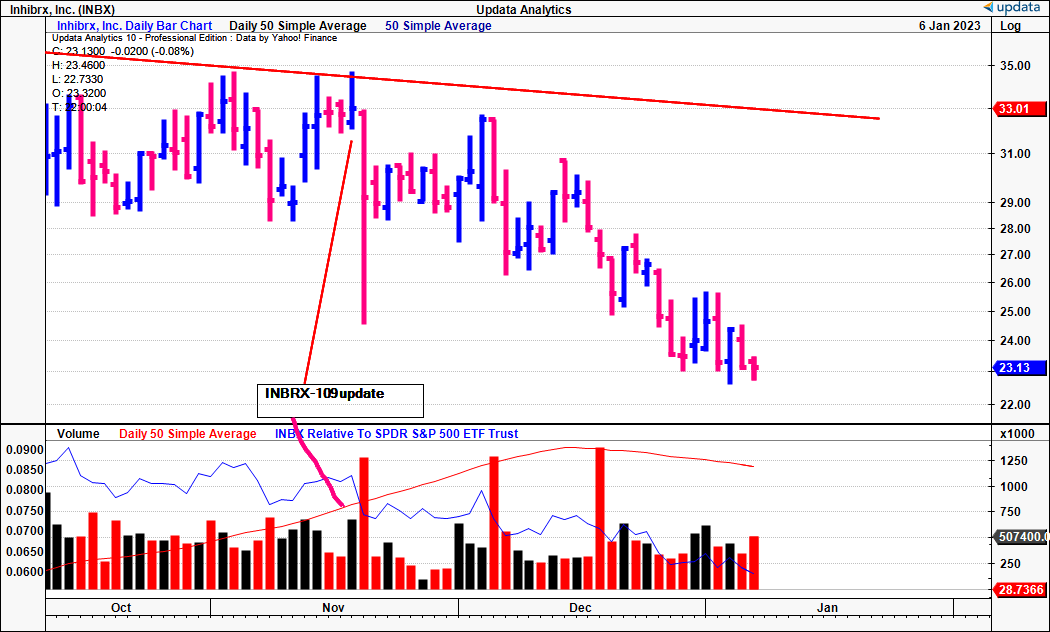
In addition, considering the market behaviour following its INBX-101 announcement, we were expecting to see similar price response when the company released updated data from its ongoing phase 1 trial in its INBX-109 program. The study, investigating the INBX-109 compound in chondrosarcoma, a rare bone malignancy, reported a disease control rate of ~88% among the total evaluable patients at the time [n=33].
However, investors completely overlooked the data readouts and instead, the stock began to drift to the downside, where it’s continued since. In addition, the daily volume following the update was equally as mute. This tells us that investors are looking for more concrete evidence of INBX’s ability to convert from its pipeline, as was the case for its INBX-101 segment in October.
Exhibit 3. Daily price action following latest updates saw muted price response, telling us investors are looking for more compelling updates
With that in mind, we decided to look at short and medium term money flows into and out of INBX equity. For those observing Exhibit 4, you’ll note that allocations to the stock have receded at pace over the last 2-3 months of trade. Should the trend continue then outflows would dominate the order book, by estimation. This tells us that investors have pulled back their allocation of risk capital towards INBX on a medium-term time frame.
Exhibit 4. Weekly money flows for INBX equity rolled over and now receding to the downside
Data: Updata
Looking at the nearer-term money flows, on a daily scale, you’ll see it’s been all outflows since November, helping to describe the corresponding price action. Moreover, the depth of outflows is increasing to the downside, such that the relative strength versus the S&P 500 [black line] has also slipped back to range as well.
In our opinion, this is a large dampener on the INBX share price’s capacity to re-rate to the upside, as investors are now net sellers of INBX equity.
Exhibit 5. Daily outflows from INBX stock driving reversal in share price from November highs.
Data: Updata
We then checked exactly what buyers were in the market at the time of the breakout from October FY22 to-date. You can see below we looked at the negative volume and positive volume indices to gauge this. The negative volume index will rise when institutional buyers are present and demonstrates the presence of more sophisticated capital, as these buyers will generally make allocations on days when overall volume is down. Retail flows on the other hand tend to follow a pattern along large volume days, and so a rise in the positive volume index indicates the presence of retail inflows.
You’ll note below the substantial divergence between the two over the past 24-months to date, however, when the October FY22 rally began, the negative index dropped to its 52-week lows. Meanwhile, the positive volume index curled up hard and has continued to December. It has since plateaued, whilst the negative volume index has just dropped to its 2-year lows. This indicates to us that there’s a lack of accumulation from institutional buyers or large accounts in INBX.
Exhibit 6. Scrutinizing institutional and retail money flows it appears the bulk of price action in the stock has been driven by smaller sized accounts, not enough to accumulate a large position in the company. This is good confluence with the last 3-months price action.
Data: Updata
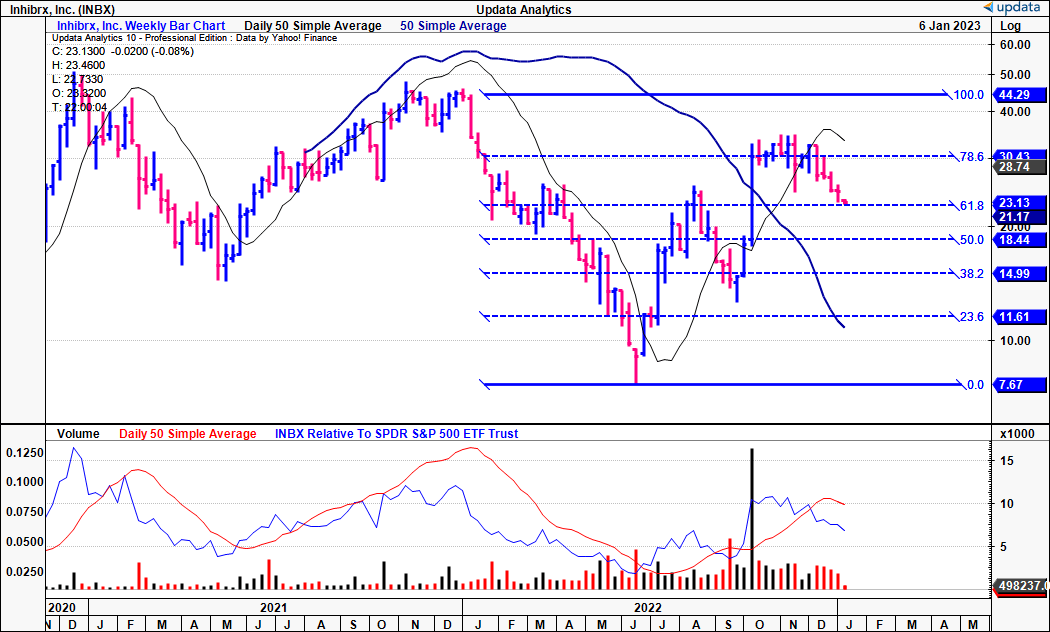
Given these points, we felt it logical to observe some potential price targets when tracing the fibs down from the December FY21 highs. You’ll see in Exhibit 7 that INBX already retraced ~78% of the move where it was unable to break higher. It rode that mark for ~7 weeks before repricing lower, and now tests the 62% level.
Should it break lower, the next target would be $18.40, then $14.90. Otherwise, if it were to rally again, it would need a reversal to $30 and then a charge to $44.
Exhibit 7. Fibonacci retracement from December FY21′ highs, with downside and upside levels shown.
As to the directional preference, we’ve now got INBX testing a key level at the base of the cloud, with the lag line in exactly the same predicament. Over the past 6 months, there’s no real evidence to suggest it has gained support at either the base or top of the cloud, and it has entered into the cloud with a downside bias. Hence, we believe there’s scope for INBX to re-rate lower, unless it can gain some buying support at its current mark.
Moreover, on-balance volume has flatlined with momentum, in support of the money flow data we described above. We believe this is further confluence of a lack of large buyers in the stock.
Exhibit 8. Testing the base of the cloud with the lagging line in exact same position.
Data: Updata
Finally, checking the point and figure studies for INBX, we note there’s a number of downside targets present, ranging from $20 to as low as $16.75. We believe there’s a chance it could head to these marks, as they’ve given good visibility on price action over the last year. These are also in-line with the Fibonacci levels discussed earlier, providing more confidence in assigning these as the next price objectives in INBX. These also support our hold thesis.
Exhibit 9. Downside targets to $20, $18.75 then $16.75
Data: Updata
In short
After expensively analyzing the available market data we believe there’s scope for INBX to reprice further to the downside. Money flows, price action, trend studies and objective price targets each corroborate that further downside from its previous highs is likely. Not discussed here, but should also be factored in, is the potential for broad equities to rate lower in the early parts of FY23 given the macroeconomic landscape as well. Net-net, we rate INBX a hold at a suggested price range of $16.75-$18.75.