Dow Jones, S&P 500, Retail Trader Positioning, Technical Analysis – IGCS Equities Update
- Retail traders keep building upside exposure on Wall Street after the holidays
- This offers a bearish contrarian trading bias for the Dow Jones and S&P 500
- Meanwhile, both indices face Death Crosses between key moving averages
Recommended by Daniel Dubrovsky
Get Your Free Equities Forecast
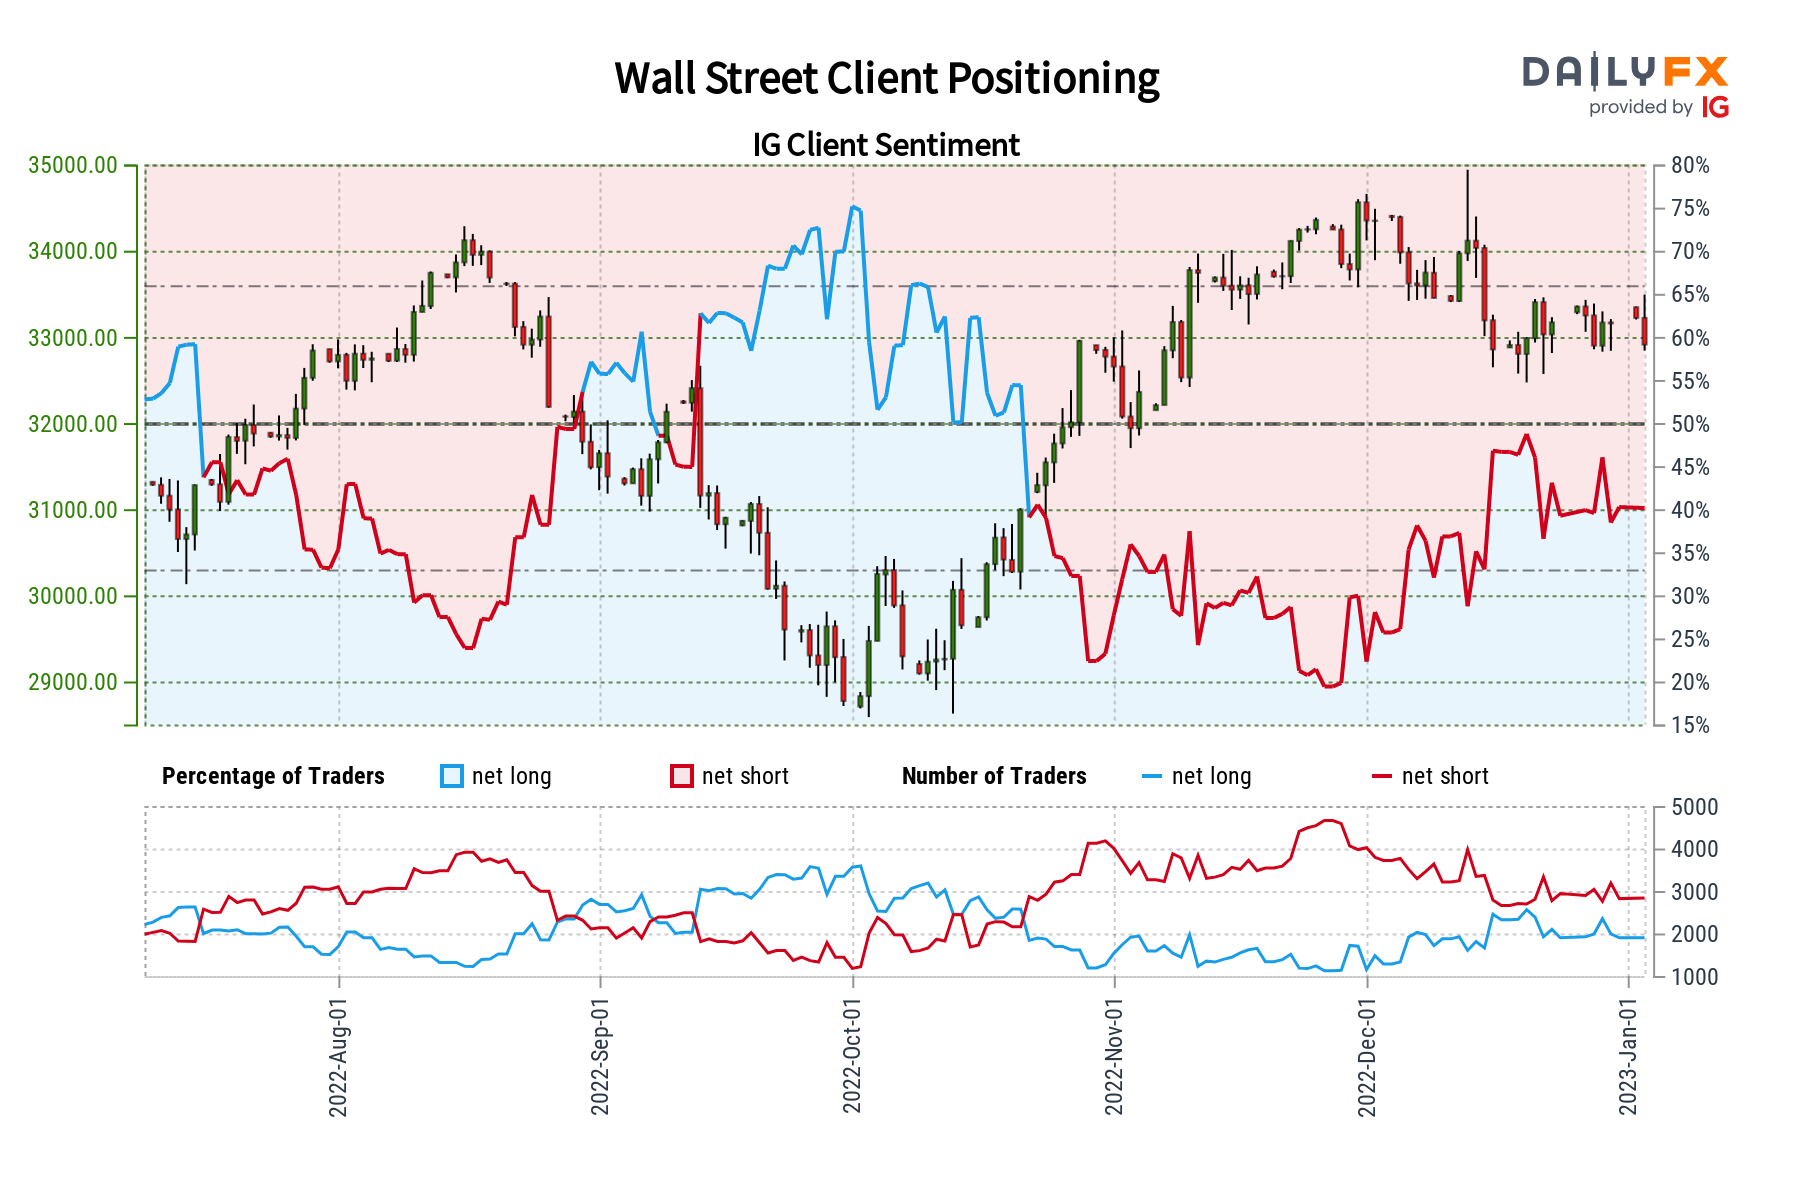
As we move further away from the Christmas and the New Year holidays, market participation will slowly rise and return to relatively normal levels. This includes retail traders. Last week, we looked at how they were positioned on Wall Street using IG Client Sentiment (IGCS). Doing so could help reveal what may come from the Dow Jones and S&P 500. IGCS tends to function as a contrarian indicator. It seems that the bearish bias for equities still holds. Let us take a closer look.
Dow Jones Sentiment Outlook – Bearish
According to IGCS, about 47% of retail traders are net-long the Dow Jones. Since most of them are net-short, this hints that prices may continue rising. But, upside exposure has increased by 28.74% and 19.03% compared to yesterday and last week, respectively. With that in mind, recent changes in exposure hint that the Dow Jones may soon reverse lower despite overall positioning.
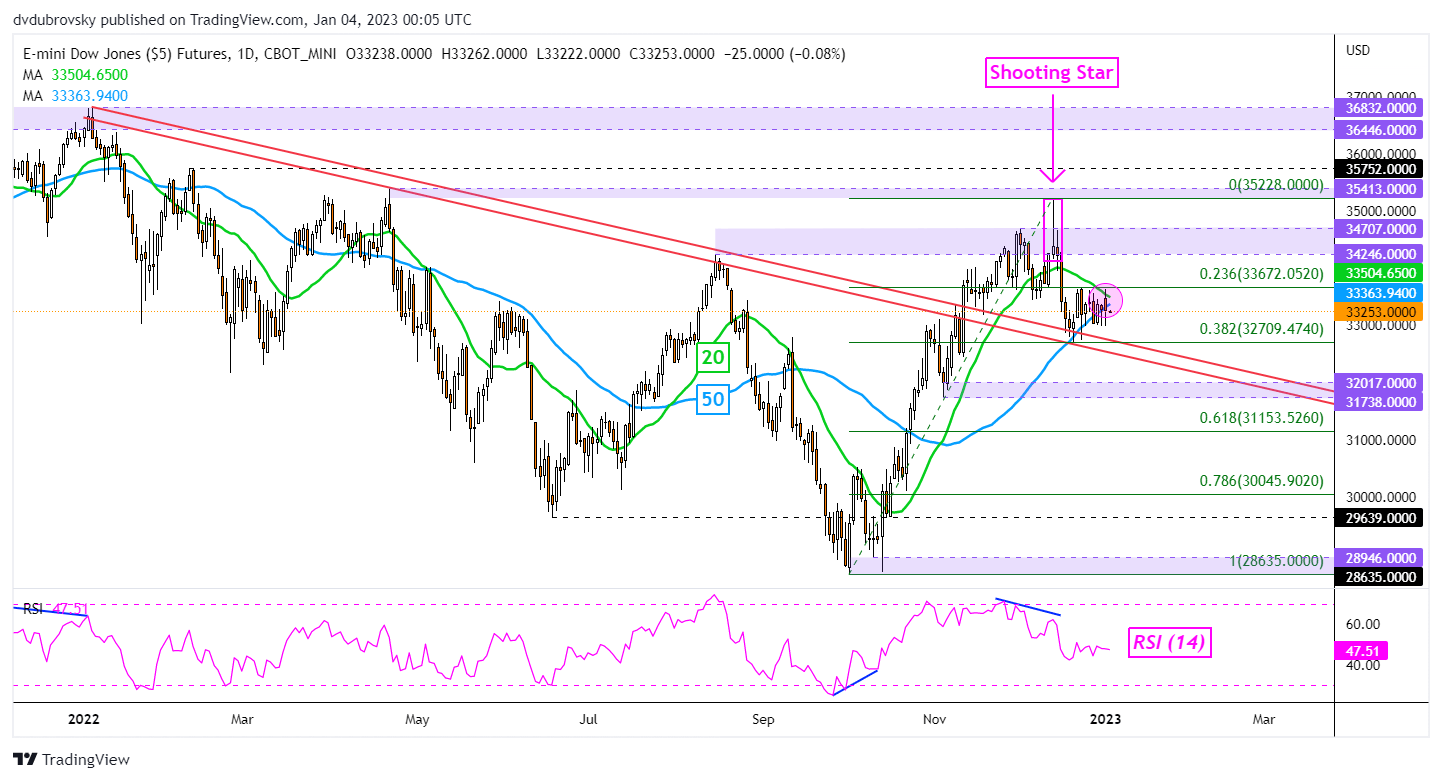
Dow Jones Futures Technical Analysis
A bearish Death Cross may be on the horizon for the Dow Jones between the 20- and 50-day Simple Moving Averages (SMAs). That could open the door to an increasingly downside technical bias. Immediate support appears to be a combination of the 38.2% Fibonacci retracement level at 32709 and the former falling trendline from the beginning of 2022. Clearing under exposes the 31738 – 32017 support zone. Otherwise, key resistance is the 23.6% retracement level at 33672.
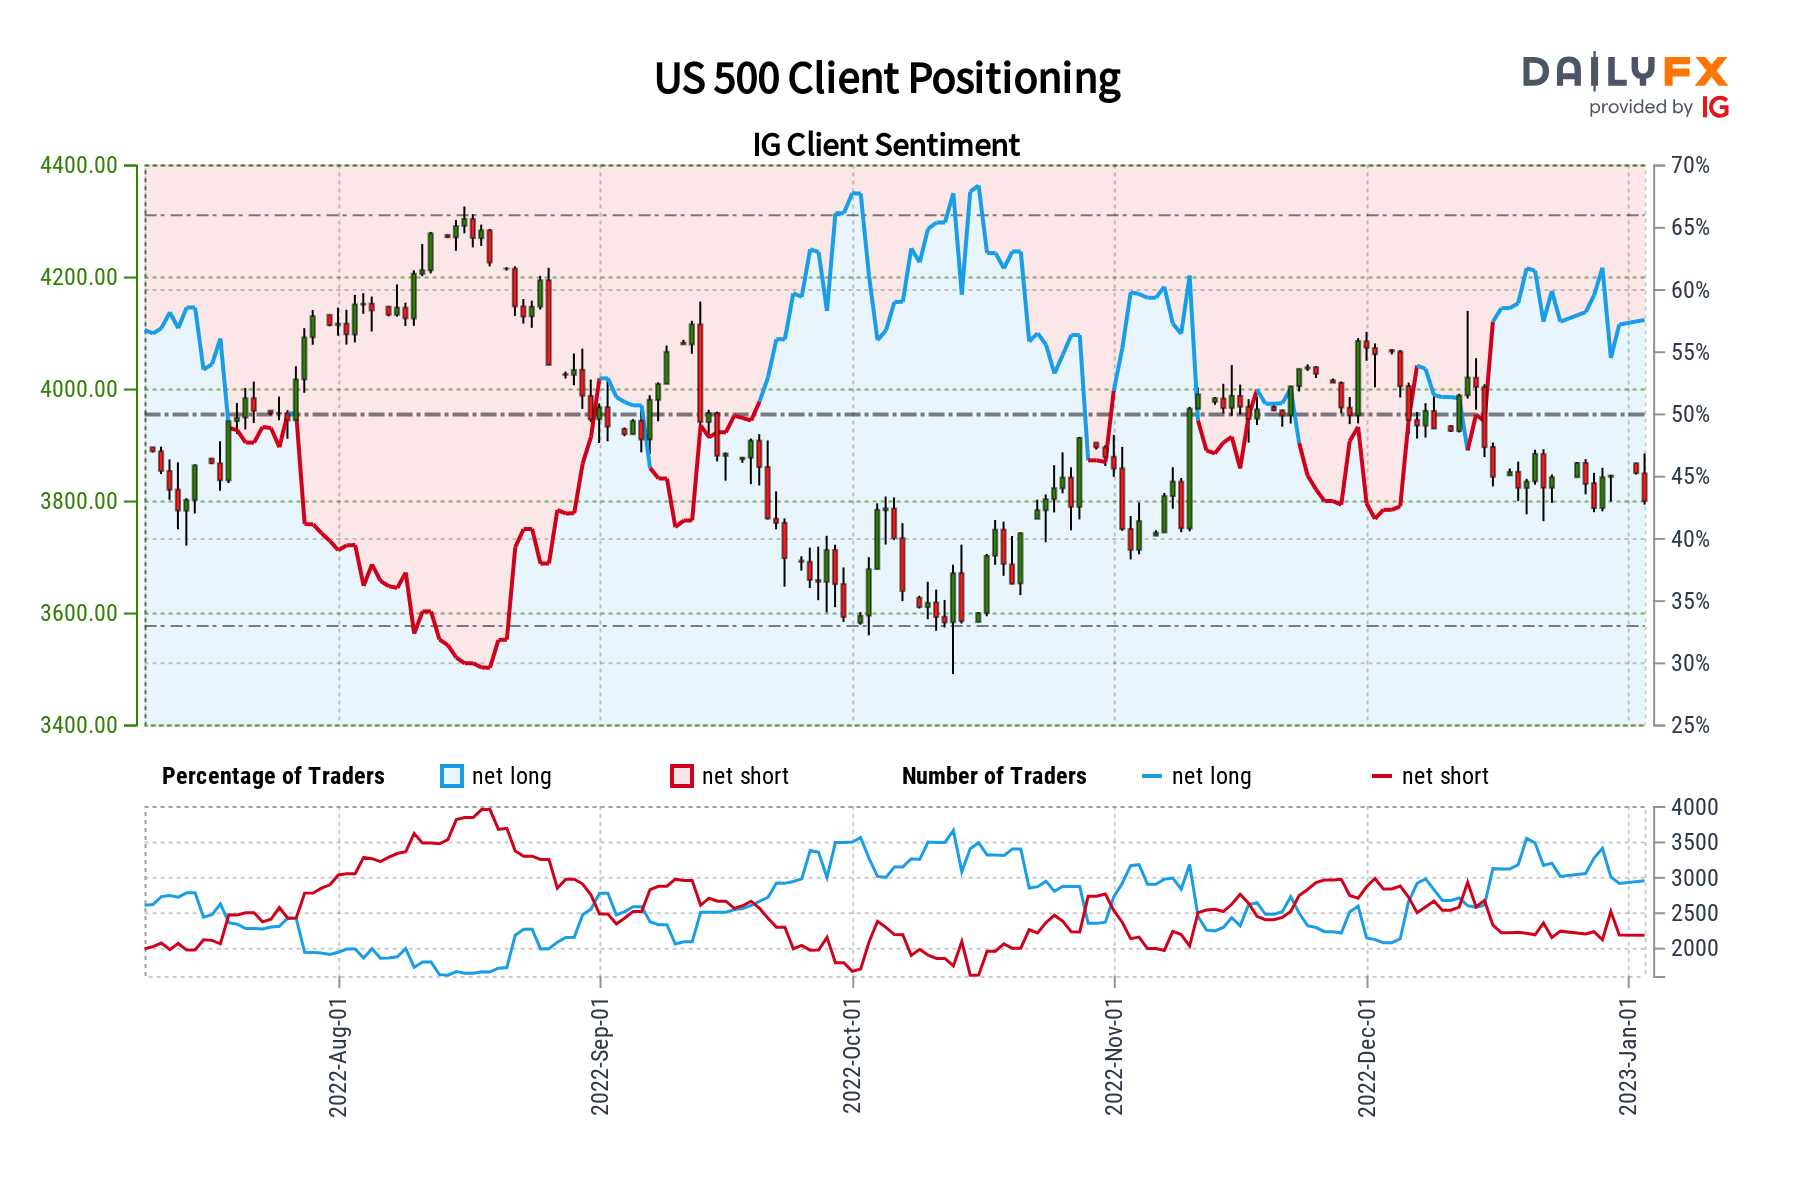
S&P 500 Sentiment Outlook – Bearish
According to IGCS, about 60% of retail traders are net-long the S&P 500. Since most traders are biased to the upside, this hints prices may continue falling. Meanwhile, upside exposure has increased by 14.79% and 2.71% compared to yesterday and last week, respectively. With that in mind, the combination of current positioning and recent changes in exposure produces a stronger bearish contrarian trading bias.
Recommended by Daniel Dubrovsky
Improve your trading with IG Client Sentiment Data
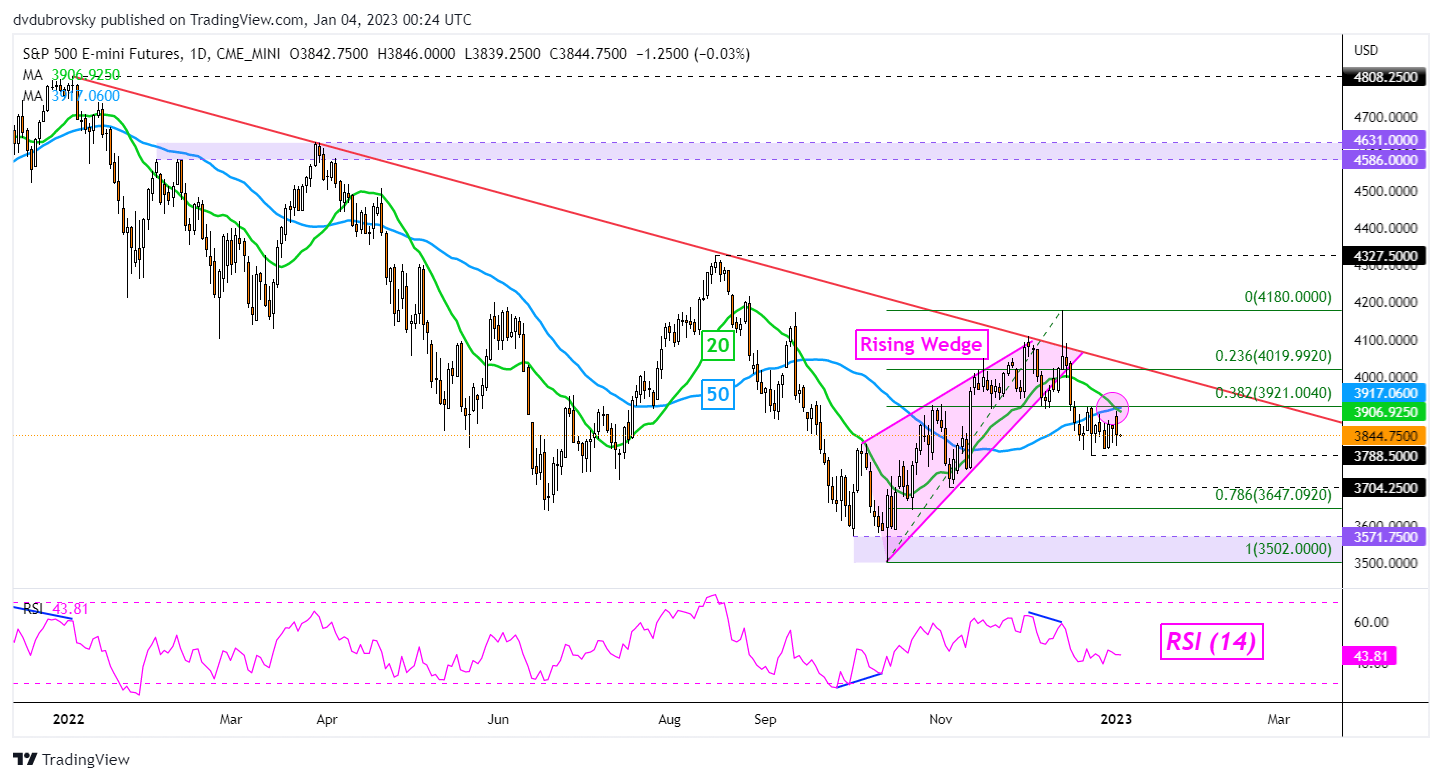
S&P 500 Futures Technical Analysis
S&P 500 futures have established a bearish Death Cross between the 20- and 50-day SMAs on the chart below. This is offering an increasingly downside technical bias after prices confirmed a breakout under a bearish Rising Wedge in December. Immediate support is at 3788. Breaking under the latter exposes 3704 towards the October low at 3502. Otherwise, key resistance is the falling trendline from last year.
— Written by Daniel Dubrovsky, Senior Strategist for DailyFX.com
To contact Daniel, follow him on Twitter:@ddubrovskyFX