Dow Jones, S&P 500, Retail Trader Positioning, Technical Analysis – IGCS Equities Update
- Volatility on Wall Street has been slowly rising since the Christmas holiday
- Retail traders have been boosting upside exposure in the Dow Jones, S&P 500
- That hints further losses may be in store for equities amid bearish technicals
Recommended by Daniel Dubrovsky
Get Your Free Equities Forecast
Volatility has been slowly on the rise following the Christmas holiday, sending equities lower on Wall Street. On Tuesday, Dow Jones and S&P 500 futures fell 1.11% and 1.23%, respectively. This seems to be in line with historical precedence at least since the VIX market ‘fear gauge’ was created in the 1990s.
Meanwhile, it seems that retail traders have been increasing their long exposure on Wall Street. This can be seen by looking at IG Client Sentiment (IGCS). The latter tends to function as a contrarian indicator. With that in mind, could volatility continue brewing in the coming trading sessions?
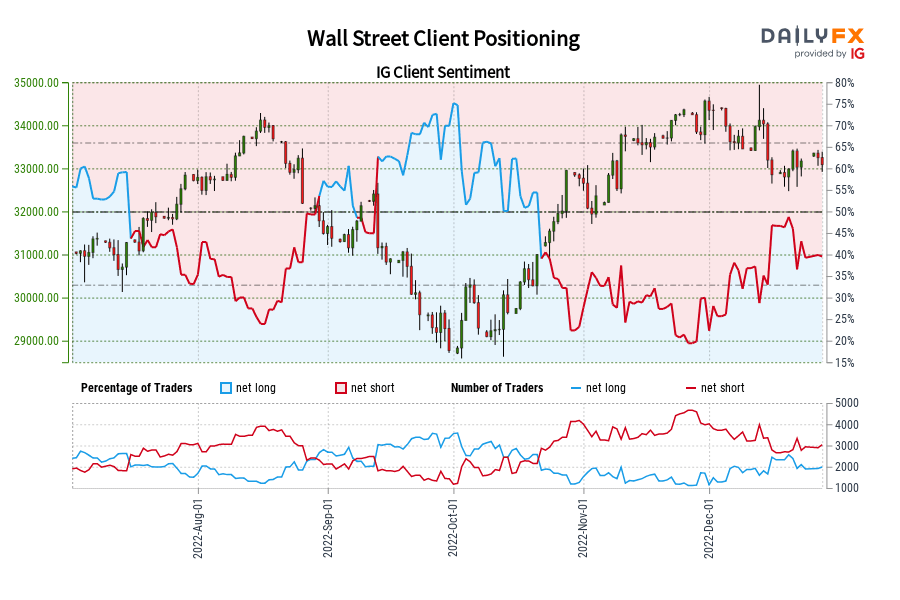
Dow Jones Sentiment Outlook – Bearish
According to IGCS, about 45% of retail traders are net-long the Dow Jones. Since the majority of them are still biased to the downside, this hints that prices may keep rising. However, upside exposure increased by 14.74% and 6.55% compared to yesterday and last week, respectively. With that in mind, recent changes in positioning warn that prices may soon reverse lower despite the overall balance of exposure.
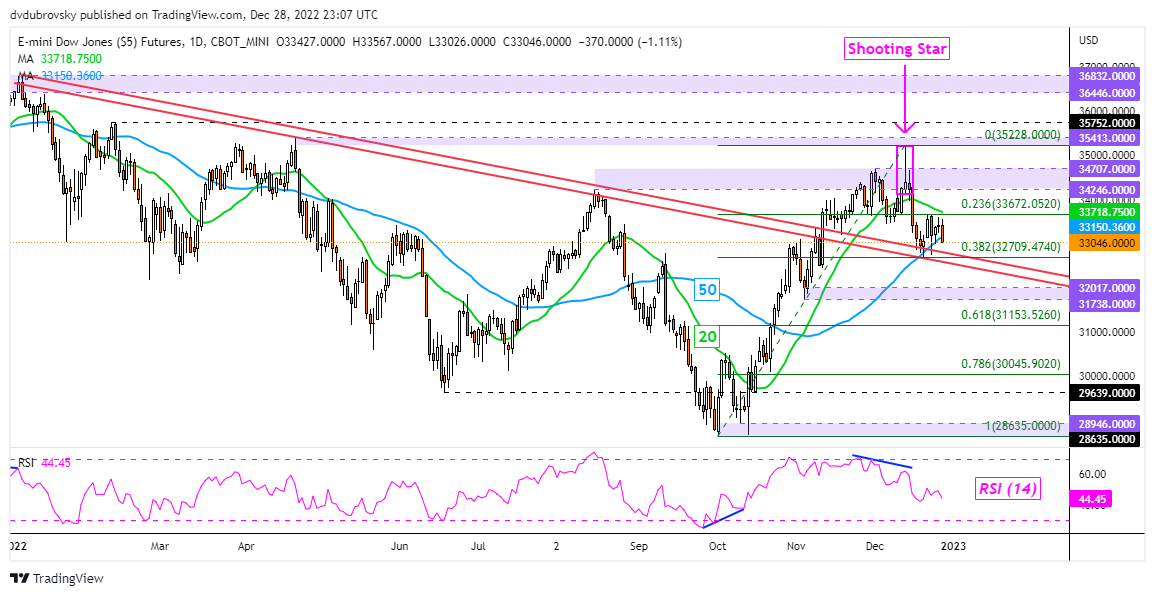
Dow Jones Futures Technical Analysis
Looking at the daily chart, Dow Jones futures have been aiming lower in the aftermath of a Shooting Star candlestick pattern. Meanwhile, prices have confirmed a push under the 20-day Simple Moving Average (SMA) and are attempting a push under the 50-day equivalent. This may open the door to a bearish Death Cross, offering an increasingly downside focus. Immediate support appears to be the 38.2% Fibonacci retracement level at 32709. Pushing under that exposes the 31738 – 32017 support zone. Otherwise, immediate resistance seems to be the 23.6% retracement at 33672.
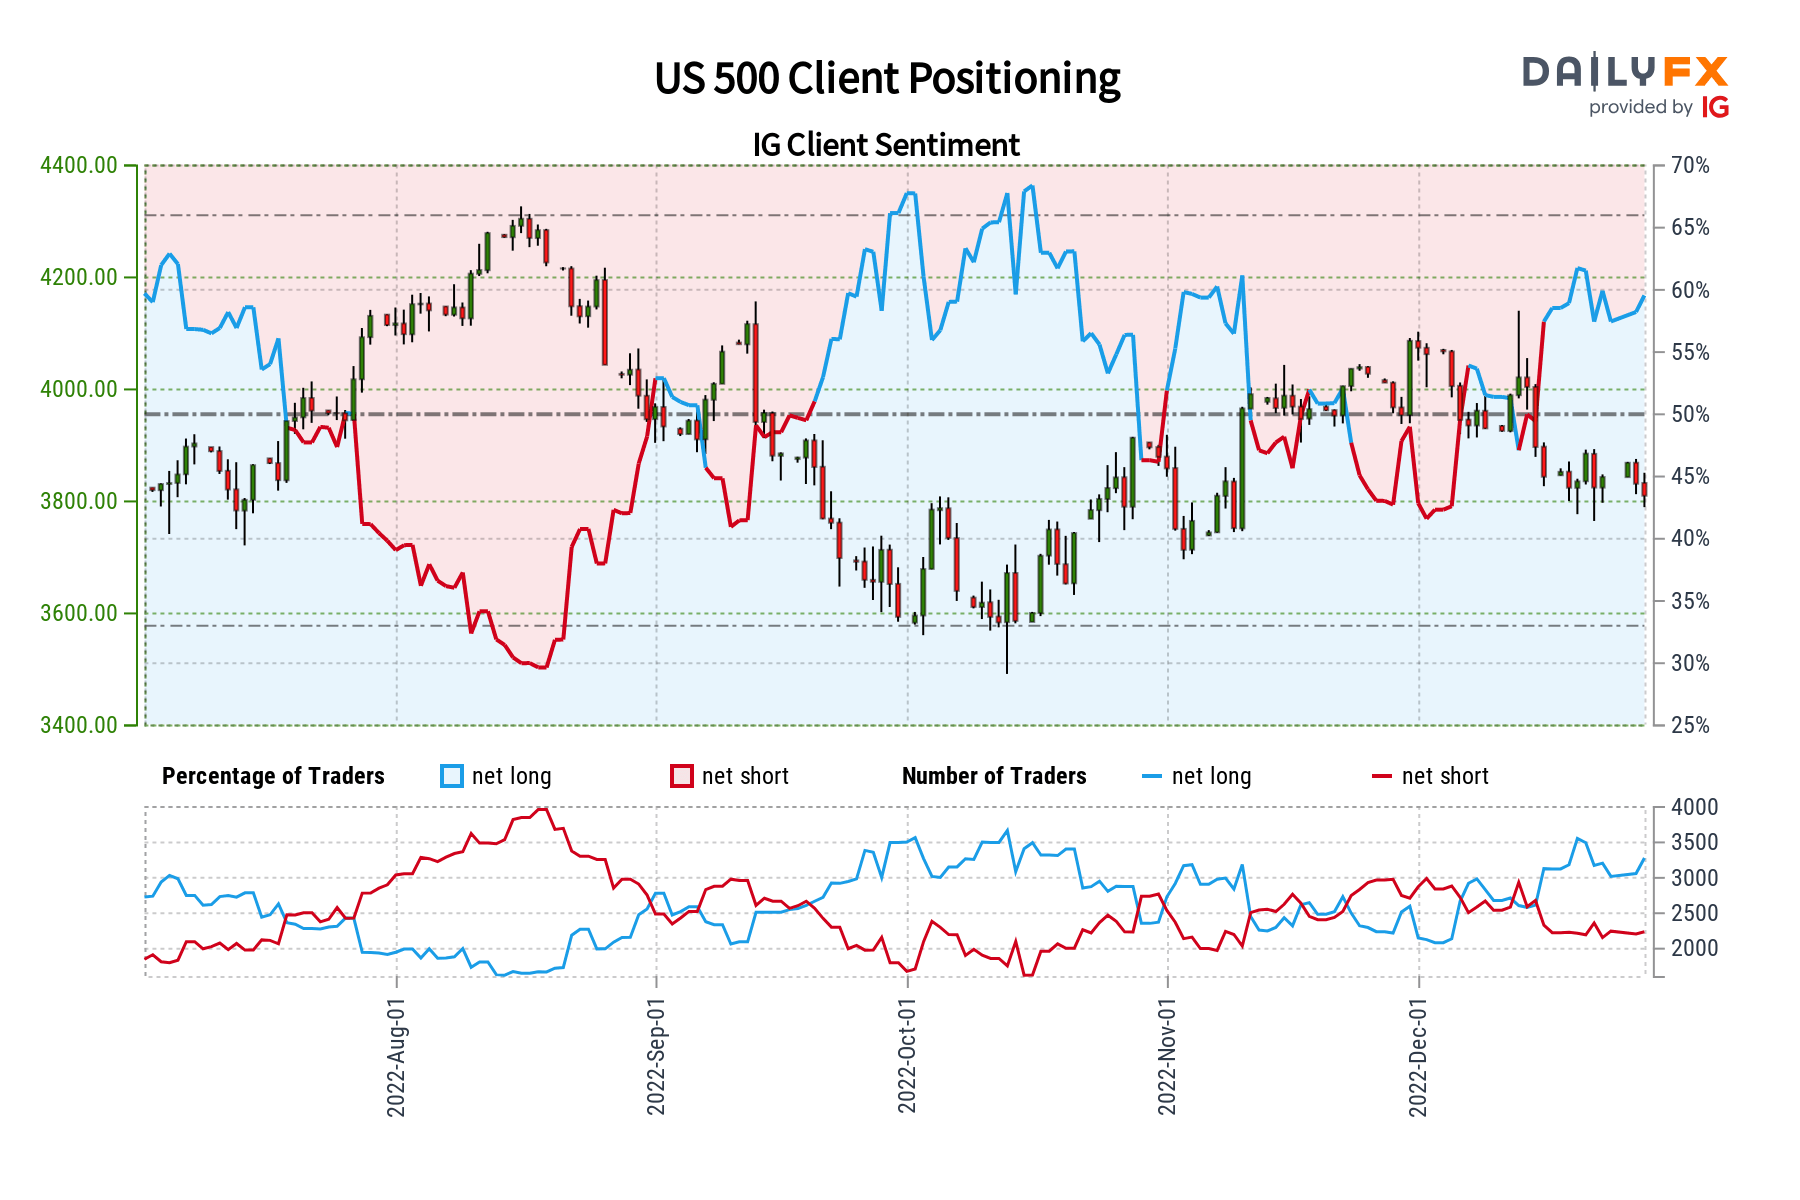
S&P 500 Sentiment Outlook – Bearish
According to IGCS, about 61% of retail traders are net-long the S&P 500. Since most of them are still biased to the upside, this hints that prices may continue lower. Meanwhile, downside bets decreased by 6.05% and 5.60% compared to yesterday and last week, respectively. With that in mind, recent changes in positioning warn that prices may soon reverse lower.
Recommended by Daniel Dubrovsky
Improve your trading with IG Client Sentiment Data
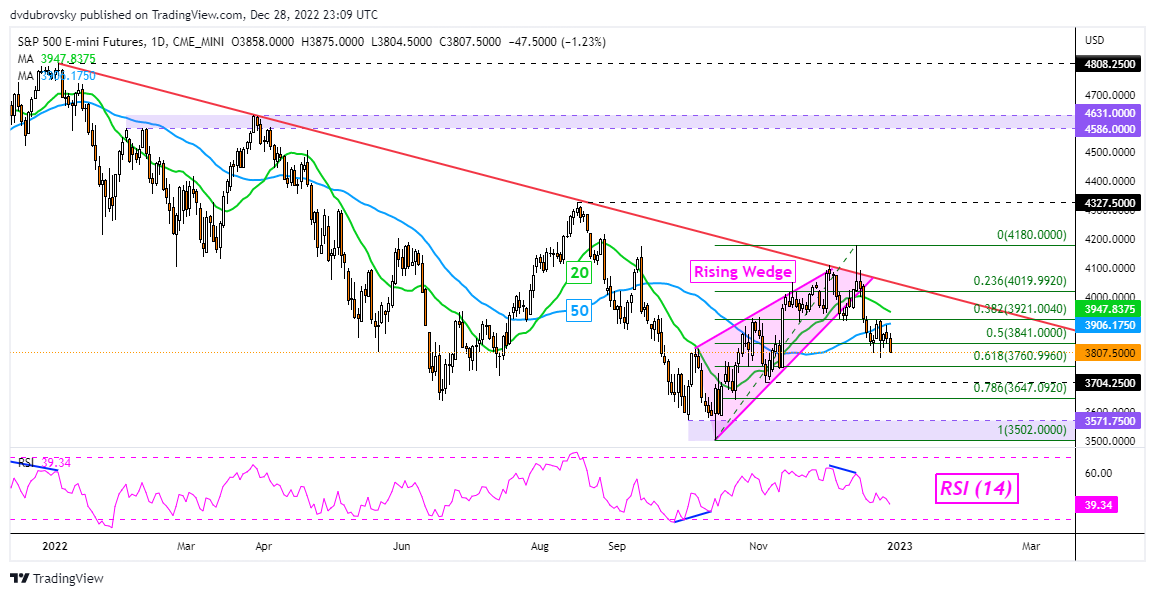
S&P 500 Futures Technical Analysis
Looking at a daily chart, S&P 500 futures closed at the lowest since November 10th. Prices have also further confirmed a breakout under a bearish Rising Wedge chart formation. The latter continues to offer an increasingly downside biased. The S&P 500 has also confirmed a breakout under the 20- and 50-day SMAs. As a result, a bearish Death Cross could be in store soon, offering a stronger downward signal. Immediate support appears to be the 61.8% Fibonacci retracement level at 3760 before 3704 comes into play. Otherwise, key resistance is the falling trendline from earlier this year.
— Written by Daniel Dubrovsky, Senior Strategist for DailyFX.com
To contact Daniel, follow him on Twitter:@ddubrovskyFX